Quantcast
Official Long-term Investments Thread - Page 3 - Beyond.ca - Car Forums
Page 3 of 53 FirstFirst ... 2 3 4 13 ... LastLast
Results 41 to 60 of 1053

Thread: Official Long-term Investments Thread

  1. #41
    Join Date
    Nov 2002
    Location
    Mr. Forex technical
    My Ride
    a tank
    Posts
    1,905
    Rep Power
    23

    Default

    Originally posted by KleanCord


    We've discussed this before but to me the current chart resembles 74-75 better than 1980.

    Wait four years for big inflation and then we have the parabola show up. Inflation cannot happen unless the money velocity increases and that will only happen when people are feeling secure again. 2 years.

    First bump 04-05 lines up with 72-73
    Second bump 06-07 lines up with 73-74

    Can you find/make a chart similar to this with inflation adjustments? That would be interesting to see.


    if you want to use inflation adjusted then these chart is what you will see gold do. however I strongly believe gold is actually catching up what happen in the 70s simply because you can tell in 86 it started another run just like today but somehow it got stopped and for 20 years it just kept pushing lower, is it any coincident that back in early 90s or was it late 80s that greenspan came out and said they will print money or do what ever it takes to keep gold prices down? something like that. So gold prices has since been pressed down until 2001.

    If you must compare chart to chart, then must I say when gold dipped 50% in 76 it retested the previous high before embarking on non stop run for 4 years. And when gold dipped to 681, it did just that, just because gold fell 50% in 76 does not mean gold will fall 50% today because it is all support and resistance, its all EW wave patterns and angle and trendlines. IF anything our recent drop pattern far looks similar to a beginning of a parabolic run of the 76 bottom. if you did look at the charts I posted in the last page, you will see the 76 bottom to 79 is virtually idental to our 07-09 pattern. they both went on retested its previous peak and took off. but in your case when you say our 08-09 ressembles 73-74, well in 73-74 it never retested its previous peak so support and retracement wise it did not line up.

    all in all I believe we ARE seeing a 5th wave pattern here that the magnitute keeps being magnified. and even time frame wise we are amost dead on because we are in the 8th-9th year of this bull run, in the 70-80 10 years. The only thing that can negate that we are in a 5th wave pattern is only if gold can close below 700, but if that happens that will look more like the run for gold has stopped and resembles the 80 peak double top that eventually came down 60% and went to sleep for 20 years. But I dont think that is the case because some article suggest in the 70s based on money supply gold should be at 250 it was both a target and a base that eventually became the bottom for 20 years, the same calculation would give today's number at around 1400 (before the trillion dollars) so if that is the case that means in 20 years gold should theorically decline back to 1400-1600 area or even 1000, that means gold has to rise 2-3 times above this level in order to put in such a dramatic sell off.
    Last edited by SilverRex; 03-27-2009 at 05:15 PM.
    _________
    2019 IS350 AWD
    20xx NX350 AWD

  2. #42
    Join Date
    Jun 2003
    Location
    YWG
    Posts
    3,119
    Rep Power
    24

    Default

    The real question when investing in gold will also depend on what the CAD/USD exchange rate is.

    If the exchange rate is over $1.50 CAD to $1 USD, what's the point in investing in gold right now?

  3. #43
    Join Date
    May 2002
    Location
    Chinatown
    My Ride
    NC1
    Posts
    10,847
    Rep Power
    87

    Default

    Buy this gold stock ETF for the long run with no leverage from ishares to get exposure to the yellow metal. (XGD)

    http://ca.ishares.com/product_info/f....do?ticker=XGD
    Originally posted by rage2
    Shit, there's only 49 users here, I doubt we'll even break 100
    I am user #49

  4. #44
    Join Date
    Nov 2002
    Location
    Mr. Forex technical
    My Ride
    a tank
    Posts
    1,905
    Rep Power
    23

    Default

    if one hasnt clicked on goldrunner's link

    here is what he says regarding the chart I posted in the last page about why we are entering a final and 5th wave up move rather than a coming wave 2 bottom.

    In 2002/ 2003 on the Forum, some posters suggested the current run in Gold would be similar to the 70's period where Gold made a "two step move." From 1970 to late 1974 Gold moved higher, then Gold suffered a pretty steep and long two year correction down into late 1976, before Gold moved into the real parabolic move up into the 1980 top. Thus, we saw Gold rise for about 4 years, then drop about 50% over 2 years, then rise in a parabola to the 1980 top. Some investors still expect to see that "two step move" in this current time-frame.

    Well, I disagreed with them, then, and I disagree with them, now. In my opinion we are in the middle of what will eventually be seen as ONE GIANT SWEEPING PARABOLIC VTH WAVE MOVE IN GOLD that will take us up to above $3,000 (maybe well-above $5,000) into 2012. That is an "Ogspvwmig" for short.

    That thought is based on the simple basics of Elliot Wave symmetry in conjunction with the main driving force of massive USD inflation that the Fed is using to battle deflation. From a common sense standpoint, if the "Texas Two-step" is correct, then we would need to suffer an approximate 4 year long correction that would retrace about 50% of the current run in Gold to equate to the 70's. I would suggest, "That cannot happen with the Fed's need to constantly accelerate US Dollar printing, or allow deflation take us to soup kitchen 1929." In terms of the Elliot Wave argument against the Texas Two-step, the move up into 1974 is clearly characteristic of a 3rd wave (confirmed on longer charts), and the drop into 1976 appears to be characteristic of a large 4th wave- specifically a falling wedge of sorts- and 4th waves usually play out as triangles. The extended wave up into 1980 is clearly a 5th wave top.

    Opposed to the 70's "Two-step" we currently appear to be in the middle of a developing Vth Wave parabolic drive in Gold, going higher as seen by the move directly from the 2000 low right up to new historic highs. The final argument against the Two-step is that the 5th wave of III seen from the wave 4 of III low, up to the 1980 high (on the left of the chart), appears fractally like an almost exact "identical twin" in both price movement and time (to today) that suggests a current expected 2011/ 2012 top- and we have correction points in each cycle that appear on the chart as "fractal identical twins" for reference points. This argument "against" is about as three-dimensional as it gets, IMO.

    [So, let me suggest what the Texas Two-steppers will eventually respond with. The fractal 5 of III move in the late 1970s suggests that at the end of the current intermediate-term move higher in Gold, we will see a sharp correction to re-test the old historic highs- one last time. Looking at the Gold chart in real-time that correction will look faintly like the start of the Two-step, BUT the correction will be much, much shorter in relative terms so it is important for us to anticipate that potential as some PM investors crawl off the PM train at the exact bottom. As/ if the correction plays out like the wave 4 of III bottom, it will eventually be apparent that the sweeping parabolic Wave V is correct.]

    Another thing that I have found interesting for yeas is that the large triangular correction from 1980 to the 2000 area looks like a large modified falling wedge that is most likely a "3 fan-line formation." What is special about a break-out of a "3 fan-line formation" is that once price breaks the top of the 3rd line of the fan, in this case the top of the triangle, there is relatively little horizontal resistance above on the chart. This formation is consistent with a 4th wave correction that will yield to a momentum run on the upside with relatively shorter and shallower corrections- and that is what we are seeing play out. Below, I will post a chart of the "3 fan-line correction" as seen in the earlier BGO chart.


    In review, in the LT chart of Gold I expect us to see a pure parabolic Vth Wave rise to continue to develop that will increasingly accelerate to the upside into 2011/ 2012, not a 2-part run with a longer correction in the middle like the 70's Gold Bull. If so, then the Vth Wave in LT Gold that we are currently in is very similar to the 5th wave of Wave III seen on the left of the chart from the "wave 4 of III low", up to the 1980 top, marked wave 5 of III. This is significant for timing purposes in many ways, not the least of which is in terms of how long it will take us to enter the most parabolic rise.

    I have marked the assumed similar points in the 5th wave of III on the left to the Vth Wave we are currently in with the letters "a" and "b." These alphabet landmarks are easy to see since they come at resistance points along the way in the chart, with "b" being "old high resistance." In my opinion, we are currently in the equivalent to the rise in the 70's to new highs toward the top of the 3rd wave of III, probably with a current vth wave of 3 of V (in the current run) left to go. If so, then we will be seeing a higher Gold price probably into May, before we see a fairly sharp correction into the end of the year or into early 2009 if there is an extension. Thus, there is the possibility that we will see an extension to wave 3 that would prolong this current up-move in time and in price. For the time being I will be looking for this current intermediate-term move to end around $1,250, knowing that there are Gann numbers at $1,150 and up around $1,437. (I will be using the intermediate Silver Momentum Chart shown in Part II of the editorial series as a reference point for "time." (In investing, we want all of the reference points we can muster.) If we do get that rise and resultant sharp correction, afterward, we would then expect to be moving into the most vertical part of the parabolic move- a wave 5 of V that would probably terminate in 2011 or 2012. I have not yet used "regular TA" to try to define what price the parabolic top for Gold into 2012 might be, but my gut has always suggested around $3,000. Hopefully, I'll have time to try to find a way to estimate such a top, but at this time I would not be surprised to see that parabolic top come in closer to $5,000, or even much higher
    _________
    2019 IS350 AWD
    20xx NX350 AWD

  5. #45
    Join Date
    Nov 2002
    Location
    Mr. Forex technical
    My Ride
    a tank
    Posts
    1,905
    Rep Power
    23

    Default

    _________
    2019 IS350 AWD
    20xx NX350 AWD

  6. #46
    Join Date
    Nov 2002
    Location
    Mr. Forex technical
    My Ride
    a tank
    Posts
    1,905
    Rep Power
    23

    Default

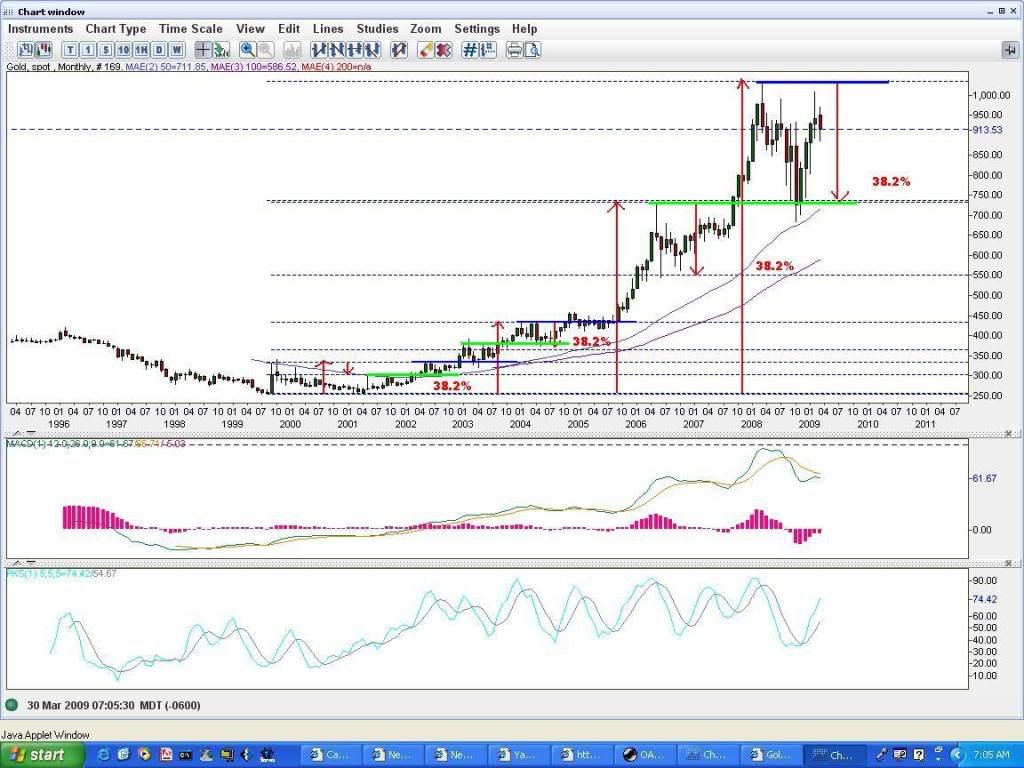
    here is more observation this morning.

    lets forget about comparing our current gold price to the 70s. and just look at the current trend.

    as I posted this chart, look at it, since 2001, gold has been moving higher amid putting in a regular 38% retracement only follow by a move even higher.

    what is interesting is, this pattern has been on going since 01, and even though the big drop in 08 would have you believe gold is done, it is still playing out like it did over and over again.

    but what is even more interesting is, when the 38% retracement actually RETEST the previous peak which is shown in green support line. it will then push a new high where the new peak becomes a support (blue line)

    so if this pattern continues to unfold like this that would mean we 38% retracement that retested the peak in 07 will result in gold price getting above 1000 and the 1000 area will become support and a base for a higher leg up in which no one knows for how much.

    based on the money supply calculation, the fact that we are in our 8th some say 9th year of this gold bull. The fact that we are forming a handle on a cup and handle pattern (ready for breakout), the fact that our chart (if you do compare to the 70s, with similarities with the start of a major run in 78) and based on the gains and ratio that puts gold in the area between 2000-3000, then it completely make sense that 1000 could be a base floor. I wont be surprise many years from now the 1000 area will be the low just like in the 80s when it bottom out at 250 (which happens to be the breakout point that went parabolic to 850) I know some of you still believe we have similarities like the 74 and gold could suddenly breakdown, but if you compare it that way, then what about in the 74 peak, gold put in about 6x gain, but today gold has only put in 4x, so if the 50% coming correction is due, then that means gold has to at least get higher one last time to a minimum around 1500-1600 then spent 4 years correction back to 800 before taking off which for even higher prices beyond 5000. Is it not coincident that (I think was jim sinclair, that bet against anyone for a million dollars legally that by 2011 Jan it will reach at least around 1650? perhaps the calculation was made that worse case we will at least see that figure)

    anyhoot

    3000 would be the perfect number for a target, because if you retrace about 60-70% like it did at the end of the run in the 80s. that puts gold right back at 1000. that all chart and price will align. Obviously some are calling even higher prices and who knows, if the situation is far worse and the gold maniuplation could offset a higher spike then 3000 for all we know could just be another leg up follow by potentially another big correction 30-50%? that could bring gold over 5 digits which some say is the number to balance the books. But I need not be greedy. anywhere from 2k-3k gold price will make anyone's day.

    Last edited by SilverRex; 03-30-2009 at 07:33 AM.
    _________
    2019 IS350 AWD
    20xx NX350 AWD

  7. #47
    Join Date
    Apr 2003
    My Ride
    2000 Honda Accord
    Posts
    38
    Rep Power
    0

    Default

    Can someone please put up an explanation of what treasuries tell us.

    I am aware of what treasuries are and how they work but I am not too sure on how to us the changing yields as a way to better predict market movement.

    Is it as simple as when the yield goes down the markets should go as eventually people will stop doing the flight to safety and realize the low percentages offer very little real financial gains? There has to be something more.

  8. #48
    Join Date
    Nov 2002
    Location
    Mr. Forex technical
    My Ride
    a tank
    Posts
    1,905
    Rep Power
    23

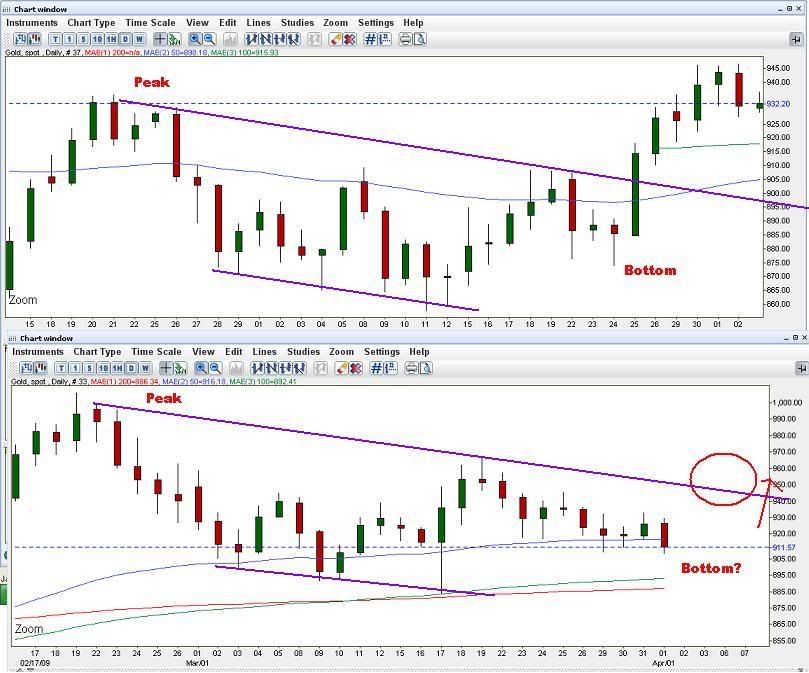
    Default

    check out this comparison, do you see similarities from the feb-apr of this year and the may-july early last year? all in all the safe way is to wait for the break of that upper purple line

    Last edited by SilverRex; 04-02-2009 at 07:06 AM.
    _________
    2019 IS350 AWD
    20xx NX350 AWD

  9. #49
    Join Date
    Jun 2006
    Location
    Toronto
    My Ride
    an overpriced civic
    Posts
    308
    Rep Power
    18

    Default

    Originally posted by liquid1010

    BPO - Brookfield owns some of the nicest properties around, and is a prime candidate to rebound nicely once the RE mess slowly turns around. It's also a great hold during inflationary periods.

    I haven't spent much time doing research lately though.... [/B]
    I'm totally with you on Brookfield. It's a perfect long term contender over a 2-5 year horizon. Low p/e, steady dividend stream...

    Originally posted by BlackFyre

    1.)Your name is RaceBread? Seriously? Like White or Whole Grain? Pumpernickel perhaps? The correct word you were looking for is Bred, as in Inbred, as in what I see in your future.

  10. #50
    Join Date
    Apr 2003
    My Ride
    2000 Honda Accord
    Posts
    38
    Rep Power
    0

    Default

    Be careful of the Corporate Retail sector. All the talk is there are large downlegs left on that side of the market.

    Time will tell, but for those looking at Brookfield it is just another thing to consider. I haven't looked into it that hard so I am am not the best one to give final judgment.

  11. #51
    Join Date
    Jan 2008
    Location
    Upstairs
    My Ride
    Natural Gas.
    Posts
    13,414
    Rep Power
    100

    Default

    If you don't mind risk, Temple REIT TR.UN is giving insane distributions, even after it's recent cuts.

    Word is that they are slightly less solid than Brookfield or Rio-Can.
    Low P/E gives me some confidence in them.
    Quote Originally Posted by killramos View Post
    This quote is hidden because you are ignoring this member. Show Quote
    You realize you are talking to the guy who made his own furniture out of salad bowls right?

  12. #52
    Join Date
    Nov 2006
    Location
    Calgary
    Posts
    462
    Rep Power
    18

    Default

    Chinese IPOs!
    Focus on Chinese companies that have dual IPO listings in China and New York.

    According to The Financial Times, the China's Bank of Communications IPO was heavily oversubscribed. Only one in 205 people got shares.
    "The IPOs are so hot, that when China Construction Bank went public in Hong Kong last year, J.P. Morgan enlisted diplomat Henry Kissinger to help get them a piece of the deal."

  13. #53
    Join Date
    Nov 2002
    Location
    Mr. Forex technical
    My Ride
    a tank
    Posts
    1,905
    Rep Power
    23

    Default

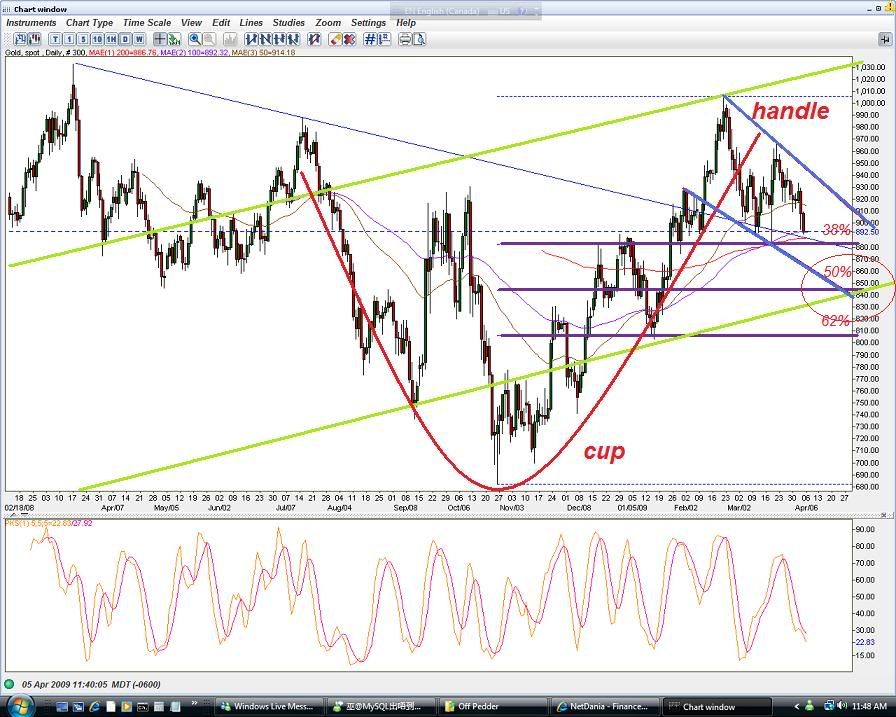
    ok im sure this has been talked about before the gold price is currently in consolidation mode, to get better picture of what it is really doing you can confidently say it is forming a very large cup and handle pattern. This pattern has been around for 8 months and is at the last stages of forming the handle.

    You can clearly see in the chart I posted.

    First what qualifies a cup and handle pattern?

    1. It forms a U shape bottom shown in red
    2. It should retrace roughly 1/3 of its prior move and no more than 50% (although some extreme could retrace 2/3) But gold retraced 34% from its 1033 high to 681 low which is perfect for this setup
    3. Handle is formed when it fails to retest the previous high (stopped at 1006)
    4. Handle will then retrace about 38% or 50% of the cup's depth which is either 123 or 163 which is 883 and 843 gold (now note: is it no wonder that gold SHOT UP 70 dollars when it touched 883.72? someone must know something to massively load up the boat at that level)
    5. Handle needs to be in some sort of flag or pennant pattern shown in blue color.

    When it is said and done, gold should breakout from the downward slop above the upper blue down trend line, that would be a key signal once it finds THE bottom. The only question is, is the bottom at 883? or 843? if 883 fails to hold, it could find its way to 843 in a heart beat. And when this cup and handle breaksout to the upside, target is measured based on the peak of the cup and the low of the cup which is about 300 dollars that will translate to gold getting to 1300 dollars before any more significant pull back.

    So the coming weeks I suspect we either see the 883 level gold or the 843 level to hold, and I do not believe it will goto the last level at around 805 because there is a up trend channel off the weekly chart denoted in green line shown.

    Therefore what does this mean? This mean one is to accumalate gold anything under 900. If your a safe investor, then wait until gold breaks above the upper blue down trendline.


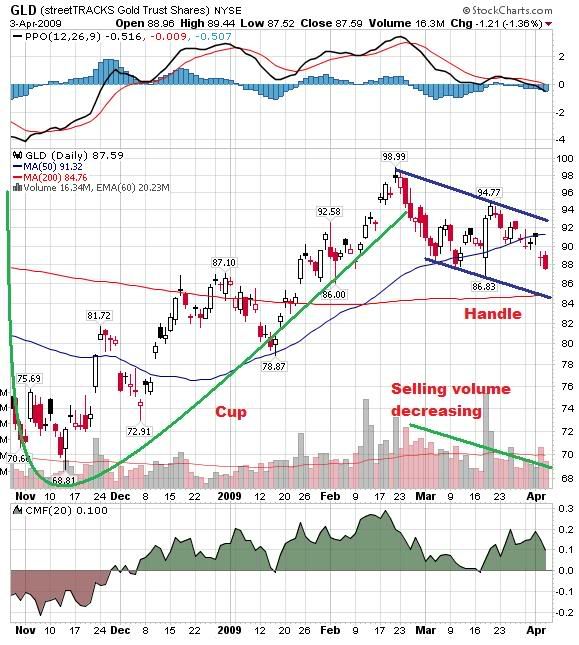
    Some will say well when applying this cup and handle pattern to stocks, there is also the volume aspect that needs to hold up as well. such that when it is forming the handle, the selling volume needs to be decreasing. Well if so, lets look at GLD chart below and again it is playing out to the pattern perfectly.

    Last edited by SilverRex; 04-05-2009 at 02:17 PM.
    _________
    2019 IS350 AWD
    20xx NX350 AWD

  14. #54
    Join Date
    Nov 2002
    Location
    Mr. Forex technical
    My Ride
    a tank
    Posts
    1,905
    Rep Power
    23

    Default

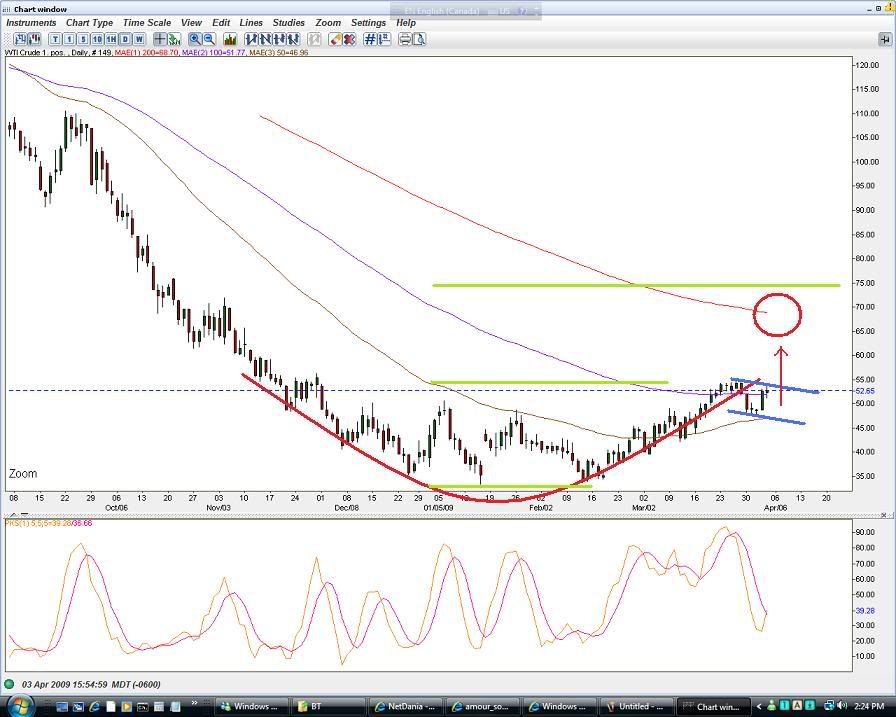
    ok this may or may not apply but it does make sense. lets look at oil
    oil too has put in an U shape bottom which if the same pattern plays out (oil breaking above the blue upper down trendline)

    Then oil is projected to hit the 70s area. which is 50% retracement from the 147 peak to 33 bottom.

    Now cup and handle pattern usually works best when the prior trend is up but since it is not, obviously we cannot take this seriously. either way I would play oil either a break above that blue line or if oil touches the lower end of the blue line, anything in between would be noise and could be difficult to trade.

    _________
    2019 IS350 AWD
    20xx NX350 AWD

  15. #55
    Join Date
    Nov 2002
    Location
    Mr. Forex technical
    My Ride
    a tank
    Posts
    1,905
    Rep Power
    23

    Default

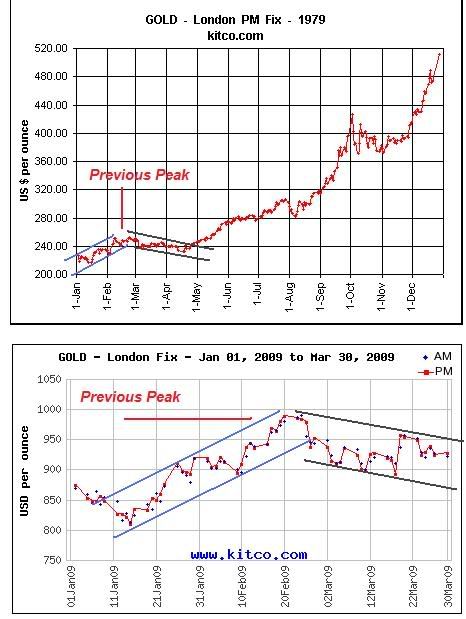
    one more chart to think about lets compare 1979 and 2009 kitco gold chart

    _________
    2019 IS350 AWD
    20xx NX350 AWD

  16. #56
    Join Date
    Nov 2002
    Location
    Mr. Forex technical
    My Ride
    a tank
    Posts
    1,905
    Rep Power
    23

    Default

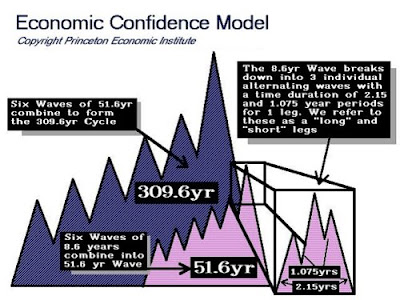
    how many of you heard or read Martin Armstrong's economic confidence model?

    http://www.contrahour.com/contrahour...he-lights.html

    based on his model in a nut shell, DOW will hit 4000 and his model suggest a turn of events on april 19 2009.

    what will this date be? his model predicted a peak of something in 2007 feburary, and it was the peak of S&P 500 and the real estate market.

    hmm april 19, 2009, comparing that to some of the things i'm seeing with the precious metal sector, a cocindent?


    typo there, it should be april 19, not march 19th. something to think about when that date approaches
    Last edited by SilverRex; 04-06-2009 at 01:46 PM.
    _________
    2019 IS350 AWD
    20xx NX350 AWD

  17. #57
    Join Date
    Nov 2002
    Location
    Mr. Forex technical
    My Ride
    a tank
    Posts
    1,905
    Rep Power
    23

    Default

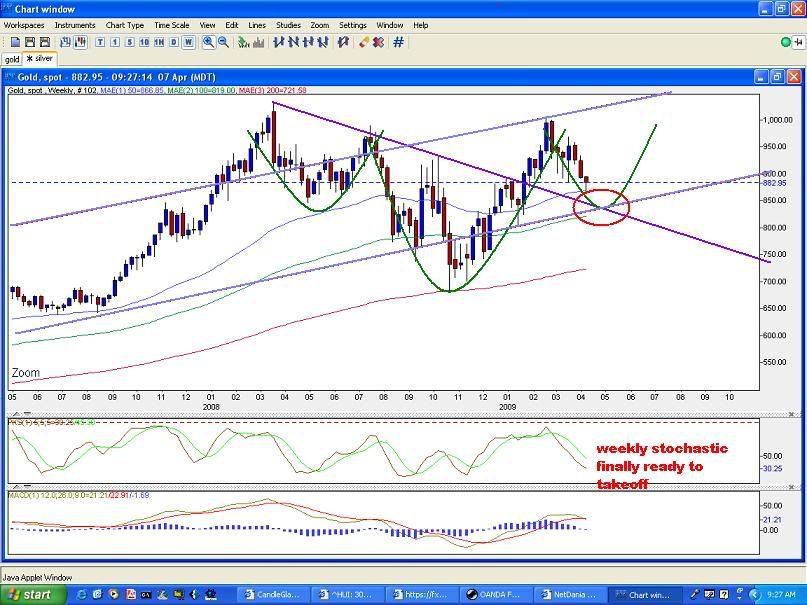
    this is what I think gold is going to do

    you cannot underestimate the strength and technical implication when gold first broke the massive down trendline shown in dark purple.

    now I think we are back to where we started back in early 08, the formation fo a 3rd bowl is in play and once it breaks 1033, this will comfirm a larger reverse H&S pattern that will push gold to new heights. Mind you just dont expect gold to goto da moon with so many factors in play, but will sure will make today's level a dream entry 6-10 months down the road.

    while it sure is nice to see gold climb back above 895 or even onto 930 at least one last time, but chart is starting to tell me it may be a matter of time until we see it swing to 840-850 and I just have to imagine this is the level where the whole world is waiting for.

    how to play this? well either wait for it or if gold somehow breaks above 930 which ever comes first.

    short term weakness does not change the bullish out look that gold remains solid for at least another year or two.

    please note the last time stoachstic indicator is this low has put in a bottom for gold going forward.

    Last edited by SilverRex; 04-07-2009 at 09:50 AM.
    _________
    2019 IS350 AWD
    20xx NX350 AWD

  18. #58
    Join Date
    May 2005
    Location
    Mountains/Calgary
    My Ride
    Das Fahrenheit
    Posts
    2,125
    Rep Power
    21

    Default

    Did anyone catch the 'Bear Attack' on BNN last night? Pretty dreadful

    Part 1:


    Part 2:


    And a Dow prediction...


    /slits wrists

  19. #59
    Join Date
    Nov 2002
    Location
    Mr. Forex technical
    My Ride
    a tank
    Posts
    1,905
    Rep Power
    23

    Default

    here's something interesting in the silver comex world

    http://harveyorgan.blogspot.com/2009...entary_07.html

    if you read the last half of the article, currently someone is withdrawning 2million ounce of silver from the silver comex warehouse since April 1st. Its the max withdrawal limit per day perhaps, and has been happening in the last 5 straight sessions bringing down the comex warehouse stock to around 63 million ounce.

    couple that with silver is in backwardation for over a month, the special April 19th turn date from the economy confidence model is around the corner, and the fact that gold is in a critical stage (between 850-900) price, do we have something or a perfect set up for a start or something big? it sure is exciting times holding the yellow and silver metals.
    _________
    2019 IS350 AWD
    20xx NX350 AWD

  20. #60
    Join Date
    Nov 2002
    Location
    Mr. Forex technical
    My Ride
    a tank
    Posts
    1,905
    Rep Power
    23

    Default

    here is another thing I notice. i've mention the economic confidence model shown a few charts above and some of the turn dates are quite amazing.

    lets take the last few, 2007 feb, shown here again, the real estate and s&p 500 peaked, then as I looked down at 2008 march what trend out there changed directions?

    then I come across the US dollar index, which precisely bottom out mid march of 2008 and began a bear market rally. and it was during this time when gold's run to 1033 ended and began a massive correction.

    so, the coming turn date April 19 (the march 19 written is a typo)
    what will be the change? the ultimate fall of the US dollar? the start of a gold bull run? the end of the recent stock market rally? and when we reach June 2011, what would be the lowest? stock market? housing? oil? a new currency?

    all eyes in mid april

    _________
    2019 IS350 AWD
    20xx NX350 AWD

Page 3 of 53 FirstFirst ... 2 3 4 13 ... LastLast

Similar Threads

  1. Official Short-term Investments Thread

    By szw in forum Real Estate / Finance
    Replies: 35559
    Latest Threads: Yesterday, 09:44 AM
  2. Fed to buy long-term U.S. government debt

    By 911fever in forum Society / Law / Current Events / Politics
    Replies: 24
    Latest Threads: 03-21-2009, 01:20 AM
  3. Calgary Racing - Long term 'protest' strategy

    By Toms-SC in forum Society / Law / Current Events / Politics
    Replies: 12
    Latest Threads: 09-14-2008, 07:59 PM
  4. Protein drinks-long term affects?

    By djhi9hlit3 in forum Health and Fitness
    Replies: 47
    Latest Threads: 01-08-2006, 08:22 PM
  5. Central North Calgary Long term plans.

    By 69cougar in forum Society / Law / Current Events / Politics
    Replies: 21
    Latest Threads: 08-25-2005, 05:06 PM

Posting Permissions

  • You may not post new threads
  • You may not post replies
  • You may not post attachments
  • You may not edit your posts
  •