Ok just alittle addon to my previous post on gold's potential run to 3000.
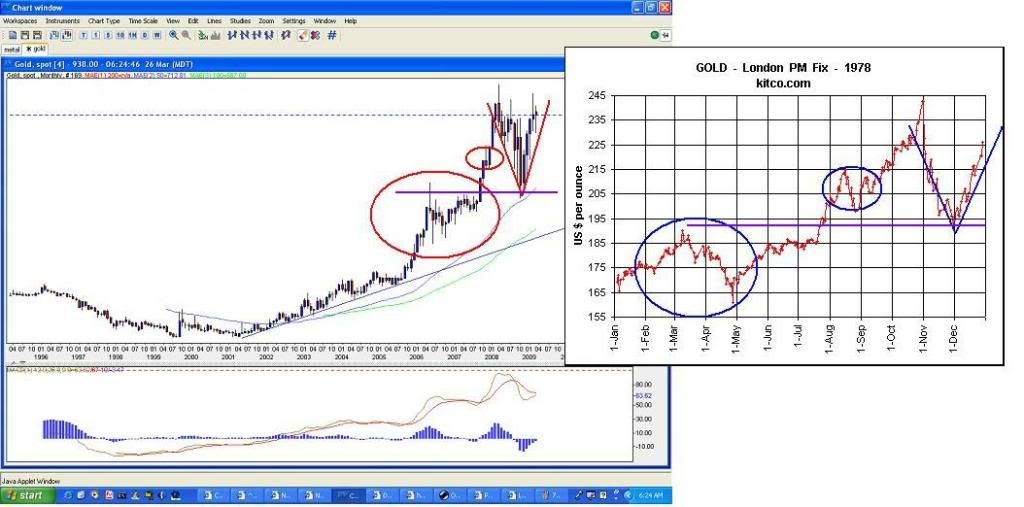
now looking at the same chart previously, you can tell that ever since the US started debasing their currency, gold went from 35 to 200 initially (about 5 years, then followed a 2 year decline before another leg up started that took gold from about 100 1976 low to 850 1980 peak for another 5 years.)
now what is interesting to know is after the peak, it dropped as much as 60% and in 1986 it started another run again that lasted until 1988 that appears to repeat the same surge that started in 1979. However from 88-2001 we could clearly see gold suddenly defying technicals, and just kept headed lower and lower.
I strongly believe the 88-01 is the gold manipulation that the US gov or the central bank is doing ever since to keep gold price down and inflate the economy to new heights (like the bubbles we see in the last few years) They are probablly doing this by simply selling their gold reserve as well as shorting the comex future contracts to a massive degree.
now lets put this 20 years surpression aside, based on the 1st two wave of gold moves in the 70-74 and the 76 to 80 we see that gold went up about 570% and 850%, that is a ratio difference of about 1.5-1.6 lets take 1.5 as a lower number.
if we apply that to gold's next or could be final move, even in EW terms we should see at least a wave 5 in this long gold run that started in 1970. This means 1.5x8.5 in our last rise would equate gold to return 12.75 times off its 250 dollar low. that translate to about 3100 dollars.
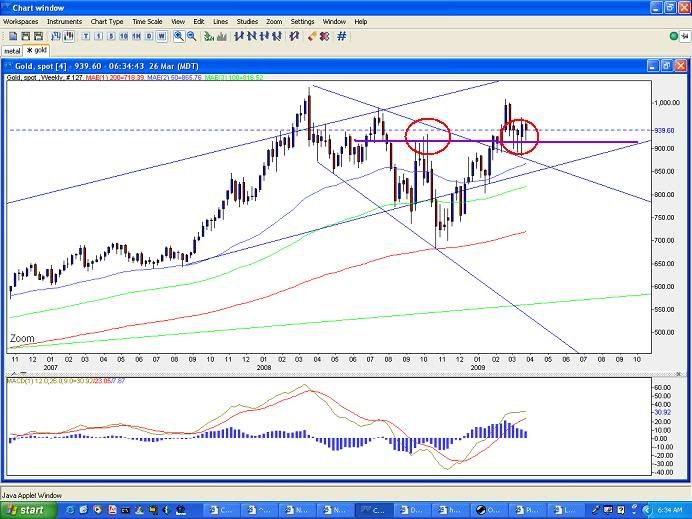
Therefore I must admit it is very good to say that gold conservatively should get to 2500-3000 area with out too much of a problem. Even if you believe gold is finish and based on just inflation numbers gold will still be at around 1000 by 2013 according to one source. that makes the 900-1000 area a really good base or platform for gold to either maintain or surge forward.
Now back to the 20 year gold maniuplation, if this is true, then what is happening here is the central banks or US gov have sucessfully cap gold prices from rocketing at least two times in the last two decade, or 3 if you want to get technical. If anything this surpression if released could push gold beyond 5 digits based on the trillions of dollar the US money supply is printing. Now if I were the US, they will do anything to drop that from happening, but yet, they know its getting more and more difficult to hold prices down, sometime tells me they will allow gold to hit 3000 simply because in their books they have held it at bay from exploding 20 years ago.
Of course it the GATA group can sucessfully expose their manipulation such as auditing the gold reserve and found out the central banks around the world do not have half the gold they claim, then there is the upside potential that gold can move beyond 3000.
all in all im saying, the gold, based on fundalmentals, technical analysis and with the same of the economy as it is now. I truely believe gold will hit 2500-3000 within the next 1-2 years with potential upside that is out of this world.

Last edited by SilverRex; 03-27-2009 at 12:45 PM.
_________
2019 IS350 AWD
20xx NX350 AWD


 Quote
Quote