Originally posted by KleanCord
We've discussed this before but to me the current chart resembles 74-75 better than 1980.
Wait four years for big inflation and then we have the parabola show up. Inflation cannot happen unless the money velocity increases and that will only happen when people are feeling secure again. 2 years.
First bump 04-05 lines up with 72-73
Second bump 06-07 lines up with 73-74
Can you find/make a chart similar to this with inflation adjustments? That would be interesting to see.


if you want to use inflation adjusted then these chart is what you will see gold do. however I strongly believe gold is actually catching up what happen in the 70s simply because you can tell in 86 it started another run just like today but somehow it got stopped and for 20 years it just kept pushing lower, is it any coincident that back in early 90s or was it late 80s that greenspan came out and said they will print money or do what ever it takes to keep gold prices down? something like that. So gold prices has since been pressed down until 2001.
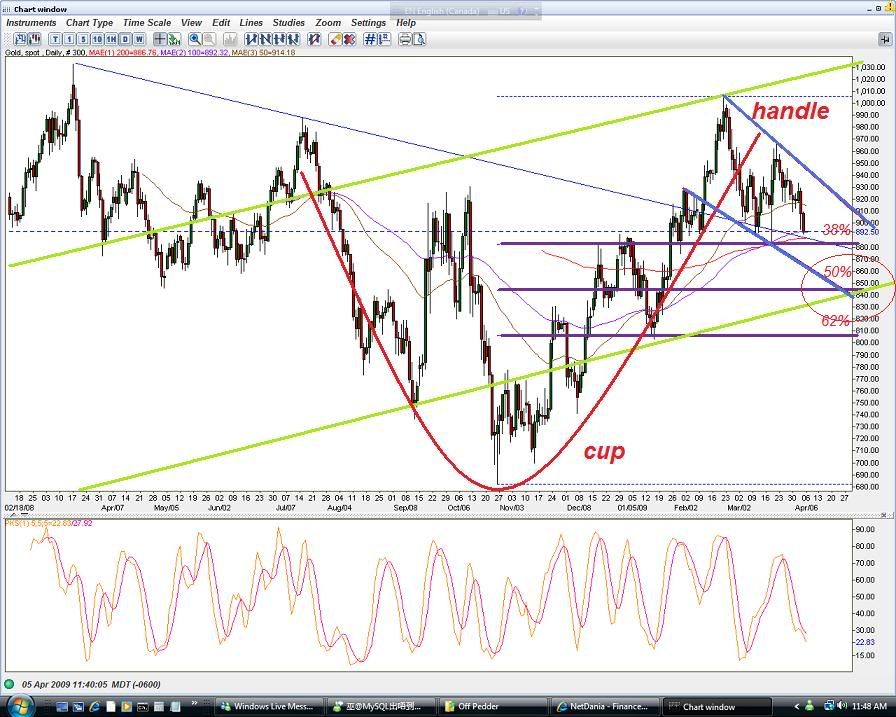
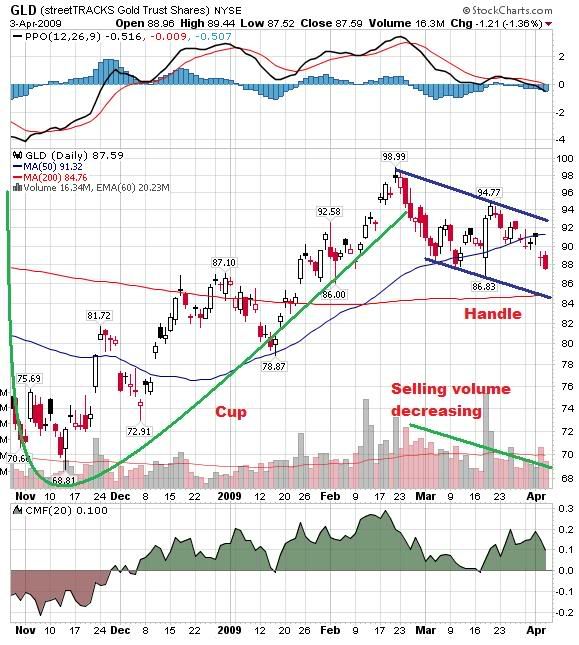
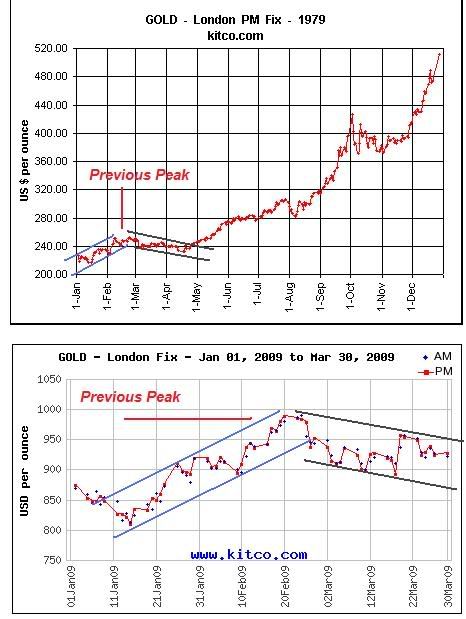
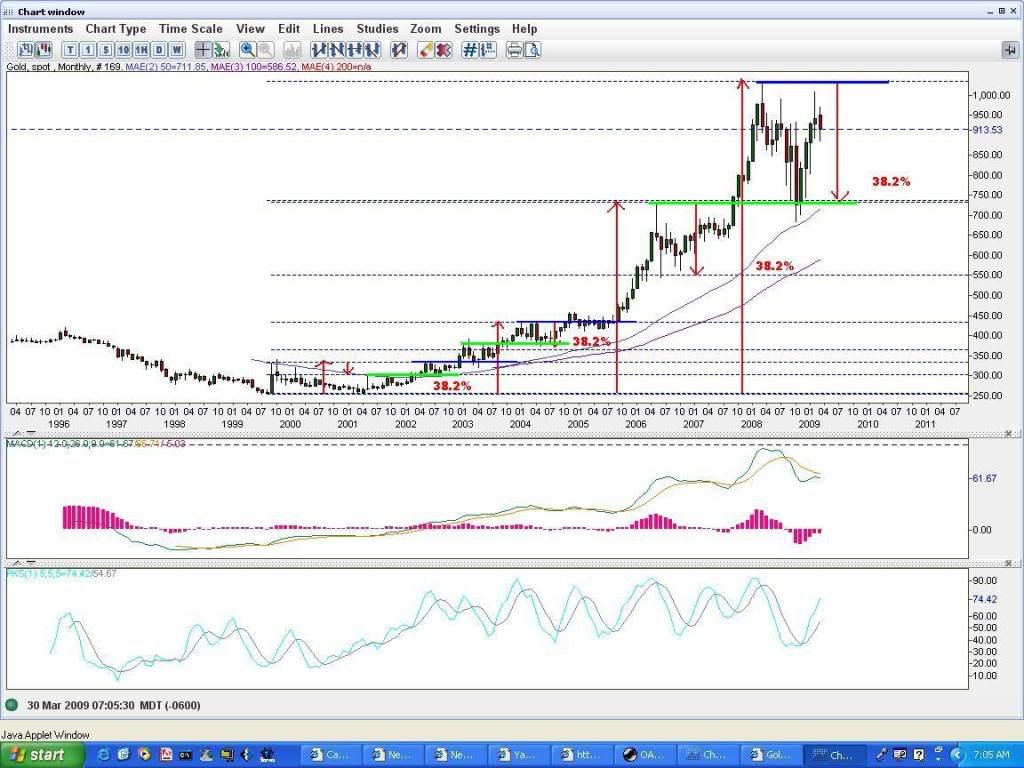
If you must compare chart to chart, then must I say when gold dipped 50% in 76 it retested the previous high before embarking on non stop run for 4 years. And when gold dipped to 681, it did just that, just because gold fell 50% in 76 does not mean gold will fall 50% today because it is all support and resistance, its all EW wave patterns and angle and trendlines. IF anything our recent drop pattern far looks similar to a beginning of a parabolic run of the 76 bottom. if you did look at the charts I posted in the last page, you will see the 76 bottom to 79 is virtually idental to our 07-09 pattern. they both went on retested its previous peak and took off. but in your case when you say our 08-09 ressembles 73-74, well in 73-74 it never retested its previous peak so support and retracement wise it did not line up.
all in all I believe we ARE seeing a 5th wave pattern here that the magnitute keeps being magnified. and even time frame wise we are amost dead on because we are in the 8th-9th year of this bull run, in the 70-80 10 years. The only thing that can negate that we are in a 5th wave pattern is only if gold can close below 700, but if that happens that will look more like the run for gold has stopped and resembles the 80 peak double top that eventually came down 60% and went to sleep for 20 years. But I dont think that is the case because some article suggest in the 70s based on money supply gold should be at 250 it was both a target and a base that eventually became the bottom for 20 years, the same calculation would give today's number at around 1400 (before the trillion dollars) so if that is the case that means in 20 years gold should theorically decline back to 1400-1600 area or even 1000, that means gold has to rise 2-3 times above this level in order to put in such a dramatic sell off.
Last edited by SilverRex; 03-27-2009 at 05:15 PM.
_________
2019 IS350 AWD
20xx NX350 AWD


 Quote
Quote


 [/B]
[/B]